US inflation and equity market
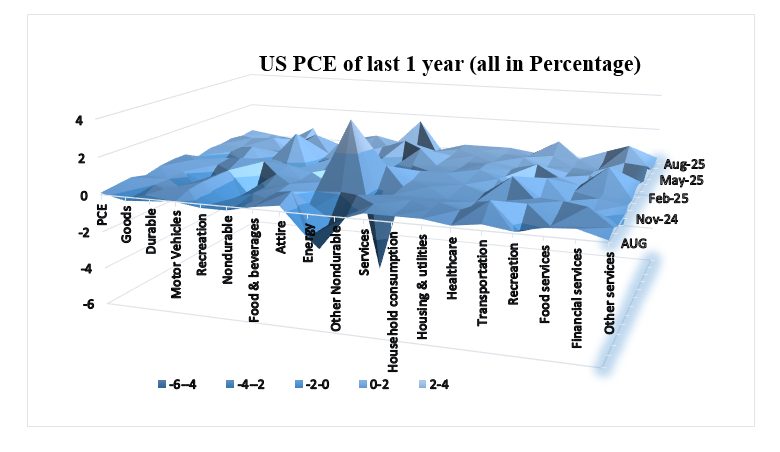
Over last one year the US economy’s inflation landscape has displayed significant movements as shown by CPI and PCE indices. Tariff policies enforced in early 2025 contributed significantly to inflation pressures, especially influencing Shelter, Energy, and Apparel categories, thus adding approximately half a percentage point to headline PCE inflation around middle of the year.
Sectoral Volatility
US stock market sectors demonstrated varied responses to these inflationary pressures, closely mirroring the performance of underlying CPI and PCE components for the specific categories. Energy stocks displayed the highest volatility, reflecting sharp swings in energy prices influenced by tariff impacts and supply constraints. The sector’s stock movements correlated strongly and inversely with CPI Gasoline and PCE Energy fluctuations. Steep energy price drops led to weakened energy stocks, while price recoveries supported rebounds. Consumer discretionary stocks, including retail and automobiles, correlated moderately with Apparel and New Vehicle inflation data. Apparel prices fluctuated between -1.2% to +0.8% monthly, and these movements aligned with retail stock volatility and price changes. Durable goods such as motor vehicles showed mixed but notable inverse correlations due to supply chain challenges and import related tariffs, resulting in modestly negative returns despite cyclical consumer demand. Defensive sectors like utilities and real estate showed relatively lower volatility, 18% and 16% respectively, therefore positive correlations with shelter inflation and utility price increases. Electricity and Natural Gas CPI components saw steady month on month rises. Real estate stocks delivered approximately 12% year on year returns, buoyed by persistently rising shelter costs and the stable revenue outlook for housing utilities. Utilities similarly benefited from increased energy prices that translated into higher earnings in regulated markets. Healthcare stocks, encompassing medical care services and commodities, correlated positively with steady inflation reported in these CPI and PCE categories. These stocks experienced volatility and recorded strong year on year gains, reflecting underlying demand resilience and consistent pricing power amidst inflation.
Market Dynamics
The rising inflation influenced by tariffs and supply chain disruptions manifested unevenly across sectors reflecting their exposure to cost pressures and consumer demand elasticity. Heightened volatility of energy stocks contrasted sharply with stability and growth of defensive real estate and healthcare sectors. Consumer discretionary stocks experienced increased swings, balancing import cost pressures with demand recovery phases.
Moreover, despite inflationary pressures, the S&P 500 index has maintained resilience. They are supported by sectors like IT and healthcare that offset tariff related drags on industries sensitive to international trade and input costs.
Bottomline
The comprehensive data over the past year reveals a clear, statistically supported relationship between inflation metrics and sector-specific stock market volatility and price trends. Tariff-driven inflation impacts disproportionately affected energy and consumer discretionary sectors, causing pronounced volatility. Conversely, sectors tied to stable inflation categories such as shelter and medical care displayed positive correlations and steadier returns. These insights emphasize the critical role inflation data like CPI and PCE play in understanding ongoing market dynamics, guiding investors to tailor portfolio allocations according to inflation exposure and sector sensitivity amid evolving economic conditions.
This article is for informational purposes only and does not constitute investment advice.